
In today’s digital age, where information is abundant and attention spans are short, infographics have become a powerful tool for conveying complex ideas quickly and effectively. Whether you’re a marketer, educator, or simply someone who loves visual storytelling, here are fifteen exceptional infographics that showcase creativity, clarity, and impact.
Table of Contents
ToggleIntroduction
In the realm of visual communication, best infographics stand out as versatile and engaging tools. They blend data, design, and storytelling into compelling narratives that captivate audiences across various platforms.
Why Use Best Infographics?
Infographics serve multiple purposes, from making data more understandable to enhancing brand storytelling. They transform dull statistics and complex concepts into visually appealing graphics that are easy to digest.

Types of Infographics
Statistical Infographics
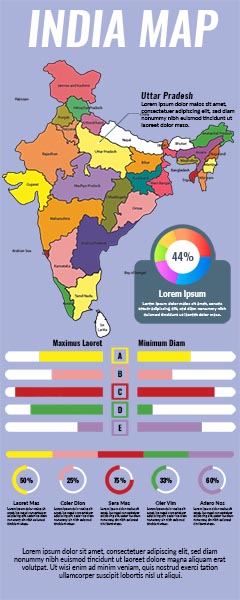
Statistical infographics focus on presenting data and statistics in a visually engaging manner. They often use charts, graphs, and diagrams to illustrate numerical information clearly.
Informational Infographics
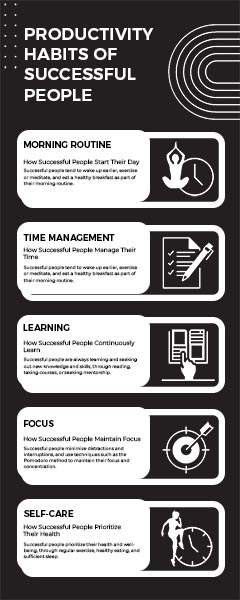
These best infographics are designed to educate and inform. They break down complex processes or concepts into step-by-step visual explanations that are easy to follow.
Timeline Infographics
Timeline infographics depict historical events, project timelines, or chronological processes using a linear visual format. They help in presenting information sequentially.
Process Infographics
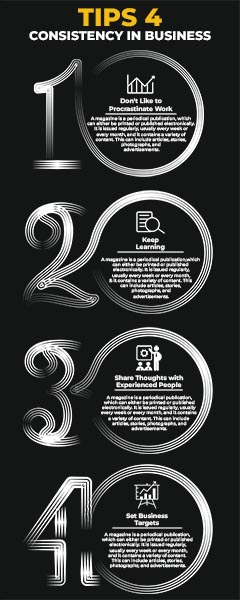
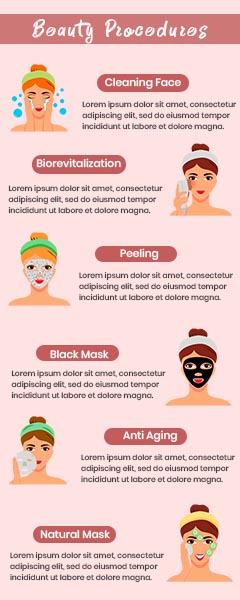
Process best infographics outline a series of steps or stages involved in a particular process. They are useful for instructional purposes and procedural explanations.
Characteristics of Effective Infographics
Clear and Concise Design
The best infographics maintain clarity through simple design elements that guide the viewer’s attention without overwhelming them with unnecessary details.
Relevant Data Presentation
Effective infographics focus on presenting data that is relevant and impactful, ensuring that every visual element contributes to the overall narrative.
Use of Color and Visuals
Color schemes and visual elements play a crucial role in enhancing the attractiveness and comprehension of infographics. They should complement the content and evoke the desired emotional response.

Best Practices for Creating Infographics
Research and Planning
Before creating an best infographics, thorough research is essential to gather accurate data and identify key insights that will resonate with your target audience.
Design Principles to Follow
Adhering to design principles such as balance, contrast, and hierarchy helps in creating visually appealing infographics that are easy to navigate and understand.
Tools and Software Recommendations
Popular tools like Canva, Crafty Art, and Adobe Illustrator offer user-friendly interfaces and templates that simplify the infographic creation process for beginners and professionals alike.
Case Study: Successful Infographic Examples
National Geographic’s Wildlife Infographic
National Geographic’s best infographics are renowned for their stunning visuals and storytelling prowess. Their wildlife infographics blend scientific accuracy with artistic flair, making complex ecological data accessible and captivating.
Airbnb’s City Guides Infographic
Airbnb uses best infographics in their city guides to highlight local attractions, travel tips, and cultural insights. These infographics engage travelers by providing valuable information in a visually appealing format.
Mayo Clinic’s Health Infographic
Mayo Clinic utilizes infographics to educate audiences about health conditions, treatment options, and preventive care. Their medical infographics combine medical expertise with patient-friendly visuals, promoting health literacy and awareness.
Infographics in Social Media Marketing
Impact of Infographics on Social Sharing
Infographics are highly shareable on social media platforms due to their visual appeal and informative nature. They attract more engagement and shares compared to text-only posts, expanding reach and brand visibility.
Platforms Suitable for Infographic Sharing
Platforms like Pinterest, Instagram, and LinkedIn are ideal for sharing infographics, as they cater to visual content and allow for easy sharing and resharing among users.

Infographics in SEO Strategies
Improving SEO with Infographics
Including infographics on your website can improve SEO by increasing dwell time, reducing bounce rates, and attracting backlinks from other sites interested in sharing valuable visual content.
Tips for Optimizing Infographics for Search Engines
Optimize your best infographics for SEO by using descriptive filenames, alt texts, and incorporating relevant keywords in the surrounding text. This helps search engines understand and index your visual content effectively.
Infographic Design Trends
Current Trends in Infographic Design
Modern infographic design trends favor minimalist aesthetics, interactive elements, and data storytelling that focuses on user experience and engagement.
Examples of Trendy Infographic Styles
Scrollable best infographics, animated infographics, and infographic videos are gaining popularity for their ability to convey information dynamically and enhance user interaction.
How to Create Your Own Infographic
Step-by-Step Guide to Creating an Infographic
Begin with a clear objective and outline. Collect reliable data and choose a design template that suits your content. Customize the infographic layout, add visuals and text, and ensure it aligns with your brand identity.
Free vs. Paid Infographic Creation Tools
Free tools like Canva and Google Charts offer basic features suitable for beginners, while paid tools such as Adobe Creative Cloud provide advanced customization options and professional-grade templates.
Infographics in Education
Benefits of Infographics in Learning
Infographics aid in visual learning by simplifying complex topics and enhancing retention through visual memory cues. They appeal to different learning styles and make educational content more engaging.
Infographics as Teaching Aids
Educators use best infographics to supplement lessons, explain processes, and summarize information visually. Students benefit from visual reinforcement and interactive learning experiences.

Infographics in Business Presentations
Using Infographics in Presentations
Business professionals use best infographics to present data, showcase product features, and convey business strategies effectively during presentations and meetings.
Examples of Impactful Business Infographics
Sales reports, market analysis, and customer journey maps are often presented as infographics to streamline information and facilitate decision-making in corporate environments.
Ethical Considerations in Infographic Design
Avoiding Misleading Data Representation
Maintain data accuracy and transparency in best infographics by citing credible sources, verifying statistics, and avoiding selective data presentation that could mislead viewers.
Citing Sources and Data Accuracy
Acknowledge sources properly and ensure all data presented in infographics is verifiable and up-to-date. Ethical infographic design builds trust with the audience and strengthens credibility.
Conclusion
Infographics continue to revolutionize visual communication by transforming complex data into engaging narratives that inform, inspire, and captivate audiences across diverse fields.


